Sha-sha Wang, Min-zhen Jian, Hai-yan Su, Wei-xue Li. First-Principles Microkinetic Study of Methanol Synthesis on Cu(221) and ZnCu(221) Surfaces[J]. Chinese Journal of Chemical Physics , 2018, 31(3): 284-290. DOI: 10.1063/1674-0068/31/cjcp1803038
Citation:
Sha-sha Wang, Min-zhen Jian, Hai-yan Su, Wei-xue Li. First-Principles Microkinetic Study of Methanol Synthesis on Cu(221) and ZnCu(221) Surfaces[J]. Chinese Journal of Chemical Physics , 2018, 31(3): 284-290. DOI: 10.1063/1674-0068/31/cjcp1803038
Sha-sha Wang, Min-zhen Jian, Hai-yan Su, Wei-xue Li. First-Principles Microkinetic Study of Methanol Synthesis on Cu(221) and ZnCu(221) Surfaces[J]. Chinese Journal of Chemical Physics , 2018, 31(3): 284-290. DOI: 10.1063/1674-0068/31/cjcp1803038
Citation:
Sha-sha Wang, Min-zhen Jian, Hai-yan Su, Wei-xue Li. First-Principles Microkinetic Study of Methanol Synthesis on Cu(221) and ZnCu(221) Surfaces[J]. Chinese Journal of Chemical Physics , 2018, 31(3): 284-290. DOI: 10.1063/1674-0068/31/cjcp1803038
State Key Laboratory of Catalysis, State Key Laboratory of Molecular Reaction Dynamics, Dalian Institute of Chemical Physics, Chinese Academy of Sciences, Dalian 110623, China
b.
School of Chemistry and Materials Science, Hefei National Laboratory for Physical Sciences at Microscales, University of Science and Technology of China, Hefei 230026, China
c.
University of Chinese Academy of Sciences, Beijing 100049, China
First-principle based microkinetic simulations are performed to investigate methanol synthesis from CO and CO2 on Cu(221) and CuZn(221) surfaces. It is found that regardless of surface structure, the carbon consumption rate follows the order:CO hydrogenation > CO/CO2 hydrogenation > CO2 hydrogenation. The superior CO hydrogenation activity mainly arises from the lower barriers of elementary reactions than CO2 hydrogenation. Compared to Cu(221), the introduction of Zn greatly lowers the activity of methanol synthesis, in particularly for CO hydrogenation. For a mixed CO/CO2 hydrogenation, CO acts as the carbon source on Cu(221) while both CO and CO2 contribute to carbon conversion on CuZn(221). The degree of rate control studies show that the key steps that determine the reaction activity of CO/CO2 hydrogenation are HCO and HCOO hydrogenation on Cu(221), instead of HCOOH hydrogenation on CuZn(221). The present work highlights the effect of the Zn doping and feed gas composition on methanol synthesis.
Methanol synthesis has attracted great interest owing to its significance in the chemical industry, where methanol can be used as liquid fuel and raw material to synthesize valuable chemical feedstock [1-3]. Additionally, the CO2 generated by using CH3OH as a liquid fuel can be recycled through the hydrogenation to CH3OH, which is believed to be promisingly to reduce CO2 emissions. Industrially, Cu-Zn-Al catalysts is commonly used in methanol synthesis at 50-100 bar, 200-300 ℃ from a feed gas mixture of CO2, CO and H2 [4].
Because of the broad range of applications and the importance of this reaction, copper-based methanol synthesis catalysts have been widely studied, but the reaction mechanism and the interplay between the catalysts' surface properties and the feed gases is still uncertain [5-10]. Several important open questions include the nature of the preferred carbon source for methanol-CO [11] or CO2 [12] and that of active sites. CO has been assumed to be the source of carbon in methanol over Cu-based catalysts from CO/CO2 mixtures, before the isotope labeling 14C experiments showed the dominance of CO2 hydrogenation [12-14]. Recently, tracer experiment in 13CO/12CO2/H2 and DFT calculation suggests a CO2 to CO shift in the dominant source of carbon in methanol with decreasing temperatures [15].
The enormous advances have been also achieved with the understanding toward active site in methanol synthesis [16-19]. Jong et al. have studied the influence of the Cu particle size smaller than 10 nm where variations in surface structures occur, under industrially relevant condition [18]. They found a dramatic decrease of specific activity when Cu particles are smaller than 8 nm, and together with DFT studies, they propose that the reaction occurs at Cu surface sites with a unique atomic structure such as step-edge sites. Additionally, it was believed that the addition of Zn can largely increase the activity of Cu catalysts. Depending on the preparation method and pretreatment conditions, different structures such as metallic CuZn alloy and Cu/ZnO interface have been detected, and controversy exists about which structure is active site and the role of Zn [17, 20, 21]. For instance, it has been implied that the turnover frequency (TOF) for methanol depends on the coverage of the coper surface with metallic Zn atoms, and the reducibility of ZnO component of the catalyst under reaction conditions prefers to decorate the low-coordinated coper sites (such as the step sites), and the terrace coordinated sites as Zn coverage increases [17, 21].
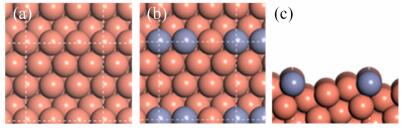
Theoretically, most mechanistic studies concentrate on the direct understanding of DFT-derived energy profiles, which gives a qualitative description of elementary pathways and relative energetics [16, 22]. However, it has been argued recently it is not sufficient to reliably assess the relative activities to methanol synthesis, and systematic kinetic study of DFT energy profile is called for [23, 24]. Herein, using DFT calculations and microkinetic simulations, we investigate CO and CO2 hydrogenation to methanol on stepped Cu(221) and CuZn(221) (FIG. 1) as observed by the high resolution transmission electron microscopy (HRTEM) under reaction conditions over Cu-ZnO catalyst [16]. The fundamental understanding can provide insights into the carbon source and feed gas composition and alloy effect on reaction activity in methanol synthesis.
Figure
1.
The surface configurations of (a) Cu(221), (b) CuZn(221), and (c) the side view of CuZn(221).
Self-consistent DFT calculations were performed via Vienna ab initio Simulation Package (VASP) [25] code. The exchange-correlation interaction were described within the generalized gradient approximation (GGA) using van der Waals interaction reversed Perdew-Burke-Ernzerhof [26] with optPBE-vdW [27]. The plane wave pseudopotential within the projected augmented wave (PAW) [28] method has a kinetic cutoff energy of 400 eV. Twelve-layer slab with (3×1) surface cell was performed to simulate stepped surface Cu(221). Surface alloy of CuZn(221)-(3×1) surface unit cell was simulated with copper atoms at step edge substituted by two Zn atoms [16, 24]. The surface Brillouin zone was described by a 5×5×1 grid mesh [29] for Cu(221) and CuZn(221). A vacuum region of 15 Å was used to avoid interactions between the slabs along the z-direction. When optimizing the adsorption energies, top six layers of Cu(221), CuZn(221), and the adsorbates were allowed to relax, while the other atoms were fixed. The optimized lattice parameter for Cu was 3.64 Å used throughout all calculations, which agreed closely with the experimental value (3.62 Å) [30].
The adsorption energies, ΔEads, were calculated as:
ΔEads=Ead/sub−Ead−Esub
(1)
where Ead/sub was the total energy of the optimized adsorbate-substrate system. Ead and Esub were the energy of adsorbed species and the clean slab, respectively. The reaction energies of the elementary steps, Er, was calculated as:
Er=∑(Eads)p−∑(Eads)r+ΔEgas
(2)
where ∑(Eads)r and ∑(Eads)p were the adsorption energies of the reactants and products at infinite separation. ΔEgas was the reaction energy in the gaseous phase. Therefore, negative and positive values of Er meant exothermic and endothermic processes. The climbing-image nudged elastic band method [31] and force reversed method [32] were employed to determine the transition states for the elementary reactions, until the force on each ion was less than 0.05 eV/Å. Activation energies (Ea) and Er were taken with respect to isolated reactants/products. Zero-point energies and corrections of entropy were not included in our calculations.
B
Microkinetic simulations
The Ea and Er of elementary reactions obtained from DFT give the backward and forward rate constant.
k=kBTℏQTSQe−(Ea/kBT)
(3)
where k is the reaction rate constant in s−1; kB, T, ℏ, Ea, QTS and Q, refer to the Boltzman constant, reaction temperature, Planck constant, the reaction barrier, the partition functions for the transition states and initial states, respectively. The pre-exponential factor of 1013 s−1 is used for the elementary reactions considered in the present work.
The molecular adsorption rate constant is expressed as:
kads=−PA′√2πmkBTS
(4)
where P, S refer to the partial pressure and the sticking coefficient (S=1 in this work). A′ and m is the surface area of the adsorption site and the mass of the adsorbate.
The rate constant for desorption is calculated by:
kdes=kBT3ℏ3A′(2πkB)σθrote−(Edes/kBT)
(5)
where σ and θ are the symmetry number and the characteristic temperature for rotation, respectively [33]. Edes is the desorption barrier, approximated by the absolute value of the binding energy. For each of the M components in the reaction network, corresponding differential equation is
ri=∑Nj=1(kjvji∏Mk=1cvjkk)
(6)
in which, kj is the rate constant of elementary reaction step j, vji is the stoichiometric coefficient of component i in elementary reaction step k, and ck is the concentration on surface.
The reaction rate is calculated by MKMCXX program [34, 35]. The rates of the individual elementary reactions were calculated based on the steady-state coverages. The limited rate step can be analyzed by the degree of rate control (DRC) [36-38]. For elementary step i, the degree of rate control XRC,i is
XRC,i=kir(∂r∂ki)kj≠i,Ki=(∂lnr∂lnki)kj≠i,Ki
(7)
where ki and Ki are the rate constants and the equilibrium constant for elementary step i, respectively, and r is the reaction rate. Furthermore, the DRC coefficients have to follow the summation rule [37]:
∑iXRC,i=1
(8)
A positive DRC for reaction step i indicates that corresponding step limits the rate of reaction, whereas negative values point to rate-inhibiting reaction steps.
Ⅲ.
RESULTS AND DISCUSSION
A
DFT calculations
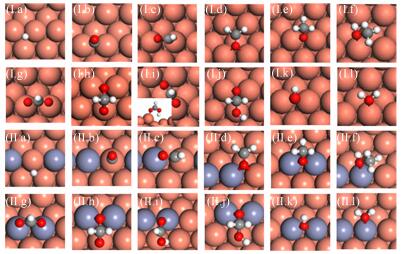
We first perform DFT calculations for CO and CO2 hydrogenation to methanol on stepped Cu(221) and CuZn(221) surface. The sequential hydrogenation mechanism via intermediates such as HCO∗, CH2O∗ and CH3O∗ is considered for the former reaction, and the well-established formate mechanism on low-coordinated Cu sites, CO2→HCOO→ H2COO/HCOOH→H2COOH→CH2O →CH3O→CH3OH, is investigated for the latter reaction. The energetic including the adsorption energy ΔEads of various intermediates and the activation energy Ea and reaction heat Er of various elementary reaction are listed in Tables Ⅰ and Ⅱ. For CO hydrogenation to methanol, two main features can be found for the adsorption of intermediates in Table Ⅰ (see FIG. 2 for the favorable adsorption structure): (ⅰ) the intermediates adsorption do not exhibit strong composition preference, with the largest variation in binding energy by 0.19 eV for CH3O∗ between Cu(221) and CuZn(221). (ⅱ) in general, the presence of Zn weakens the species binding, with the exception of OH∗ and CH3O∗. These results can be well understood since Zn and Cu are in the neighboring group, and both possess a d10 electronic configuration, leading to the similar bond strength of species. The slightly weaker atomic/molecular binding on CuZn may arise from a combination of both geometric (such as bond length) and electronic effect. Based on many common electronic structure descriptors, such as lower d-band center and less charge transferred, etc. can lead to lower bond strength [39]. The discussion about the role of Zn can also be found in recent study by Liao et al. [40].
Table
Ⅰ.
Adsorption energies (ΔEads in eV) of intermediates involved in methanol synthesis from CO and CO2 on stepped Cu(221) and CuZn(221).
Table
Ⅱ.
Calculated activation energies (Ea in eV), reaction energies (Er in eV) of the elementary reactions involved in methanol synthesis from CO and CO2 on Cu(221) and CuZn(221).
The structure insensitive intermediates adsorption leads to slight variation in reaction heat (Er) and activation energy (Ea) of elementary reaction between Cu(221) and CuZn(221). The hydrogenation of CH2O∗ with Er differing by at most 0.33 eV (Table Ⅱ) is found, as CH3O∗ depends most strongly on surface structure among the possible intermediates. The difference in Ea generally falls in the range of 0.20-0.30 eV, and CuZn(221) has slightly higher Ea than Cu(221). Compared to HCO and CH2O hydrogenation, which have the modest Ea, CO, CH3O, and OH hydrogenation is more difficult (0.9-1.2 eV) on the two surfaces. These results are in consistent with previous report on Cu(211) and CuZn(211) [16].
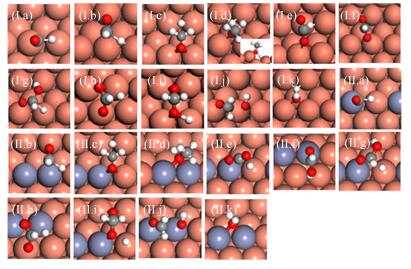
For CO2 hydrogenation to methanol, generally, the presence of Zn slightly weakens the adsorption of intermediates, which is similar to CO hydrogenation. Interestingly, H2COO∗ binds more strongly on CuZn(221) than on Cu(221) by 0.29 eV. As shown in FIG. 2(h), the adsorption configurations of H2COO∗ on the two surfaces are very similar, except that one of O atoms binds with Zn on CuZn(221) instead of Cu on Cu(221) at the step edge. Therefore, the enhancement role of CuZn(221) may originate from the stronger Zn-O bond as compared to Cu-O bond. We have previously classified the adsorption bond to ionic and covalent bond [39]. As the decrease in energy level difference between metal and adsorbate, the strength of ionic bond gradually decreases whereas that of covalent bond gradually increases. In this context, the smaller energy difference between Zn and O may lead to stronger covalent bond.
The addition of Zn mildly lowers the Ea (by 0.10 eV at most) of the most elementary steps in hydrogenation of CO2 (Table Ⅱ, see the configuration of transitions states in FIG. 3). Among the elementary steps, CO2 and HCOOH∗ hydrogenation and H2COOH∗ decomposition are quite facile, with the Ea of no more than 0.85 eV on Cu(221) and CuZn(221). However, HCOOH∗, H2COO∗ and H2COOH∗ formation are more difficult, and the Ea ranges from 1.07 eV to 1.74 eV on the two surfaces. Our calculations agree well with previous DFT study on Cu(211) and CuZn(211) [16] and metal doped Cu(111) [41].
Figure
3.
Optimized configurations of transition states of elementary reactions involved in methanol synthesis on Cu(221) (Ⅰ) and CuZn(221) (Ⅱ):
Having obtained the energetic for CH3OH synthesis from CO2 and CO on Cu(221) and CuZn(221) surface, we will focus on the kinetics of the reaction in this section. How does Zn affect methanol yield? What is the carbon source of methanol synthesis? What is the key reaction step to determine the reaction activity? To provide insights into these questions, a microkinetic simulation was conducted at total pressure of 50 bar in 400-670 K, with different CO2 ratios (CO/H2=1/4, CO/CO2/H2=1/1/9 and CO2/H2=1/4).
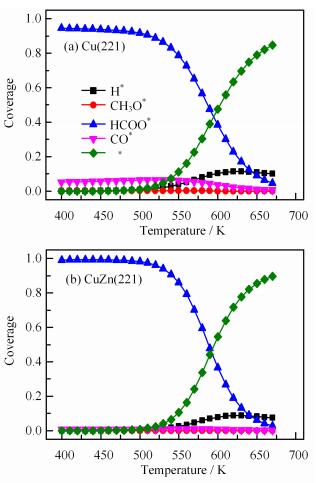
Microkinetic simulations predict the formation rate of methanol as a function of the reaction temperature. As shown in FIG. 4(a), the composition of feed gas has a dramatic influence on the methanol formation rate, which follows the order of CO hydrogenation>CO/CO2 hydrogenation>CO2 hydrogenation on Cu(221) regardless of temperature. CuZn(221) follows the same order as on Cu(221), but having lower rate. As shown in FIG. 4(b), compared to Cu(221), the presence of Zn greatly retards CO hydrogenation by 1.2×10³-4.3×10³ times, CO/CO2 hydrogenation by 1.2×10³-7.4×10⁴ times and CO2 hydrogenation by 40-300 times. Moreover, the activity difference of the three reactions on CuZn(221) is smaller than on Cu(221). The methanol formation rate generally increases with increasing temperatures on both Cu(221) and CuZn(221), which is caused by the rapid decrease of HCOO∗ coverage and increase of empty sites and the surface H coverage with temperature (see FIG. 5).
Figure
4.
Activity of methanol synthesis on (a) Cu(221) and (b) CuZn(221). (c) The carbon source in the feed gas of CO/CO2/H2 as a function of temperatures at 50 bar total pressure.
Figure
5.
Coverage of main surface species for methanol synthesis as a function of temperatures on (a) Cu(221) and (b) CuZn(221) in CO/CO2/H2 mixture feed gas (H2/CO/CO2=9/1/1).
To provide insight into the carbon source in methanol synthesis, we separate the total conversion rate of CO/CO2 hydrogenation to the rate of CO and CO2 conversion. As shown in FIG. 4(c), the apparent barrier of CO conversion (the slope) is lower than that of CO2 conversion by 6.8 kJ/mol on Cu(221), and CO conversion is 7-6400 times faster than CO2 conversion. However, the case is quite different from CuZn(221). The rate of CO2 conversion is very close to that of CO conversion at the temperature region considered. Consequently, CO acts as the carbon source on Cu(221), while both CO and CO2 contribute to carbon conversion on CuZn(221).
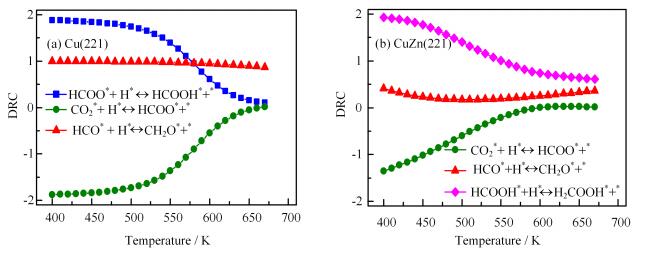
The reaction steps controlling carbon consumption can be decided by DRC for each elementary step considered (see Method Section for a more detailed description). As shown in FIG. 6(a), on Cu(221) formate hydrogenation (HCOO∗+H∗→HCOOH∗+∗) primarily controls methanol synthesis rate at lower temperature (T < 550 K) and CHO hydrogenation (HCO∗+H∗→CH2O∗+∗) controls the rate at the temperature above 550 K. This may be because that the surface is covered by HCOO at lower temperatures, which block the active sites for CH3OH formation. The increased HCOO hydrogenation rate can help remove HCOO species and in turn enhance the activity of carbon consumption. With increasing temperature, more empty sites are available and the HCO hydrogenation rate largely controls the methanol synthesis rate. However, on CuZn(221), formic acid hydrogenation (HCOOH∗+H∗→H2COOH∗+∗) controls the methanol formation rate at the temperature region considered (FIG. 6(b)). This means the increase in HCOOH hydrogenation rate can improve methanol synthesis rate.
Figure
6.
Degree of rate control (DRC) of methanol synthesis as a function of temperatures on (a) Cu(221) and (b) CuZn(221) in CO/CO2/H2 mixture feed gas (H2/CO/CO2=9/1/1).
According to the DFT and microkinetic simulation results, the rate of CO hydrogenation is higher than that of CO2 hydrogenation on Cu(221). However, CuZn(221) retards dramatically the conversation rate of CO and CO2, especially for CO. To explain this, we note that the key elementary reactions for CO hydrogenation, such as CH2O formation, have lower barrier than those for CO2 hydrogenation, such as CO2/HCOO hydrogenation on Cu(221). On the other hand, Zn doping generally increases the Ea for CO hydrogenation reactions, whereas slightly decreases those for CO2 hydrogenation reactions. The distinct dependence of reactivity on feed gas also results in the variation in carbon source with a mix CO/CO2 feed gas on Cu(221) and CuZn(221). Specifically, the carbon switches from CO on Cu(221) to both CO and CO2 on CuZn(221). Our calculations agree well with previous experiment by Schlögl et al. [24]. They found higher TOF for CO hydrogenation than that of CO/CO2 at 30 bar and 503 K with Cu supported on an inert MgO support, however, on CuZn catalyst, the reversed trend is observed. The DRC studies show that the key steps that determine the reaction activity of CO/CO2 hydrogenation are HCO∗ and HCOO∗ hydrogenation on Cu(221), while HCOOH∗ hydrogenation on CuZn(221). The rate increase of these steps by interface can greatly enhance the reaction activity on the two surfaces.
Ⅳ.
CONCLUSION
The effect of alloying and feed gas composition on methanol synthesis is investigated by optPBE-vdW DFT and microkinetic simulation. The results show that both Cu(221) and CuZn(221) have higher carbon consumption rate for CO hydrogenation, followed by CO/CO2 hydrogenation and CO2 hydrogenation. Carbon comes from CO on Cu(221) whereas both CO and CO2 on CuZn(221) for a mixed CO/CO2 hydrogenation. The DRC studies show that the key steps that determine the reaction activity of CO/CO2 hydrogenation are HCO∗ and HCOO∗ hydrogenation on Cu(221), rather than HCOOH∗ hydrogenation on CuZn(221). Further works should be done to unbiasedly estimate the various possible sites to get a reasonable and comprehensive knowledge of active sites, such as other types of low-coordinated copper sites, Cu/ZnO interface, and reaction mechanisms information.
Ⅴ.
ACKNOWLEDGMENTS
This work was supported by the National Key R & D Program of China (No.2017YFB0602205, No.2017YFA0204800), the National Natural Science Foundation of China (No.91645202, No.91421315), the Chinese Academy of Sciences (No.QYZDJ-SSW-SLH054, No.XDA09030101).
P. L. Hansen, J. B. Wagner, S. Helveg, J. R. RostrupNielsen, B. S. Clausen, and H. Topsoe, Science 295, 2053(2002). doi: 10.1126/science.1069325
[9]
J. Nakamura, Y. Choi, and T. Fujitani, Top. Catal. 22, 277(2003). doi: 10.1023/A:1023588322846
[10]
M. Muhler, E. Tornqvist, L. P. Nielsen, B. S. Clausen, and H. Topsoe, Catal. Lett. 25, 1(1994). doi: 10.1007/BF00815409
[11]
K. Klier, V. Chatikavanij, R. Herman, and G. Simmons, J. Catal. 74, 343(1982). doi: 10.1016/0021-9517(82)90040-9
[12]
G. C. Chinchen, P. J. Denny, D. G. Parker, M. S. Spencer, and D. A. Whan, Appl. Catal. 30, 333(1987). doi: 10.1016/S0166-9834(00)84123-8
[13]
K. Klier, Adv. Catal. 31, 243(1982).
[14]
G. C. Chinchen, P. J. Denny, J. R. Jennings, M. S. Spencer, and K. C. Waugh, Appl. Catal. 36, 1(1988). doi: 10.1016/S0166-9834(00)80103-7
[15]
Y. Yang, C. A. Mims, D. H. Mei, C. H. F. Peden, and C. T. Campbell, J. Catal. 298, 10(2013). doi: 10.1016/j.jcat.2012.10.028
[16]
M. Behrens, F. Studt, I. Kasatkin, S. Kuehl, M. Haevecker, F. Abild-Pedersen, S. Zander, F. Girgsdies, P. Kurr, B. L. Kniep, M. Tovar, R. W. Fischer, J. K. Norskov, and R. Schloegl, Science 336, 893(2012). doi: 10.1126/science.1219831
[17]
S. Kuld, M. Thorhauge, H. Falsig, C. F. Elkjaer, S. Helveg, I. Chorkendorff, and J. Sehested, Science 352, 969(2016). doi: 10.1126/science.aaf0718
[18]
R. van den Berg, G. Prieto, G. Korpershoek, L. I. van der Wal, A. J. van Bunningen, S. LaegsgaardJorgensen, P. E. de Jongh, and K. P. de Jong, Nat. Commun. 7, 13057(2016). http://europepmc.org/abstract/med/27703166
[19]
S. Kattel, P. J. Ramirez, J. G. Chen, J. A. Rodriguez, and P. Liu, Science 355, 1296(2017). doi: 10.1126/science.aal3573
[20]
T. Lunkenbein, J. Schumann, M. Behrens, R. Schloegl, and M. G. Willinger, Angew. Chem. Int. Ed. 54, 4544(2015). doi: 10.1002/anie.201411581
[21]
S. Kuld, C. Conradsen, P. G. Moses, I. Chorkendorff, and J. Sehested, Angew. Chem. Int. Ed. 53, 5941(2014). doi: 10.1002/anie.201311073
[22]
F. Studt, F. Abild-Pedersen, J. B. Varley, and J. K. Nørskov, Catal. Lett. 143, 71(2013). doi: 10.1007/s10562-012-0947-5
[23]
L. C. Grabow and M. Mavrikakis, Acs Catal. 1, 365(2011). doi: 10.1021/cs200055d
[24]
F. Studt, M. Behrens, E. L. Kunkes, N. Thomas, S. Zander, A. Tarasov, J. Schumann, E. Frei, J. B. Varley, F. Abild-Pedersen, J. K. Norskov, and R. Schloegl, Chemcatchem 7, 1105(2015). doi: 10.1002/cctc.201500123
[25]
G. Kresse and J. Furthmuller, Comput. Mater. Sci. 6, 15(1966).
I. A. Filot, R. A. van Santen, and E. J. Hensen, Angew. Chem. Int. Ed. 53, 12746(2014). doi: 10.1002/anie.201406521
[35]
I. A. Filot, R. J. Broos, J. P. van Rijn, G. J. van Heugten, R. A. van Santen, and E. J. Hensen, ACS Catal. 5, 5453(2015). doi: 10.1021/acscatal.5b01391
C. Stegelmann, A. Andreasen, and C. T. Campbell, J. Amer. Chem. Soc. 131, 8077(2009). doi: 10.1021/ja9000097
[39]
H. Y. Su, K. Sun, W. Q. Wang, Z. Zeng, F. CalleVallejo, and W. X. Li, J. Phy. Chem. Lett. 7, 5302(2016). doi: 10.1021/acs.jpclett.6b02430
[40]
F. Liao, X. P. Wu, J. Zheng, M. M. J. Li, A. Kroner, Z. Zeng, X. Hong, Y. Yuan, X. Q. Gong, and S. C. E. Tsang, Green Chem. 19, 270(2017). doi: 10.1039/C6GC02366E
[41]
Y. Yang, M. G. White, and P. Liu, J. Phy. Chem. C 116, 248(2011).
Cui, T., Chen, Q., Zhang, Y. et al. Promotion of activity and stability mechanisms of adjusting the Co ratio in nickel-based catalysts for dry reforming of methane reaction. Molecular Catalysis, 2024.
DOI:10.1016/j.mcat.2024.113946
2.
Shi, Y.-F., Ma, S., Liu, Z.-P. Copper-based catalysts for CO2 hydrogenation: a perspective on active sites. EES Catalysis, 2023, 1(6): 921-933.
DOI:10.1039/d3ey00152k
3.
Halim, H.H., Morikawa, Y. Elucidation of Cu-Zn Surface Alloying on Cu(997) by Machine-Learning Molecular Dynamics. ACS Physical Chemistry Au, 2022, 2(5): 430-447.
DOI:10.1021/acsphyschemau.2c00017
4.
Li, J., Wan, Q., Lin, G. et al. DFT study on the catalytic role of α -MoC(100) in methanol steam reforming. Chinese Journal of Chemical Physics, 2022, 35(4): 639-646.
DOI:10.1063/1674-0068/cjcp2204075
5.
Shi, Y.-F., Kang, P.-L., Shang, C. et al. Methanol Synthesis from CO2/CO Mixture on Cu-Zn Catalysts from Microkinetics-Guided Machine Learning Pathway Search. Journal of the American Chemical Society, 2022, 144(29): 13401-13414.
DOI:10.1021/jacs.2c06044
6.
Liu, X., Luo, J., Wang, H. et al. In Situ Spectroscopic Characterization and Theoretical Calculations Identify Partially Reduced ZnO1−x/Cu Interfaces for Methanol Synthesis from CO2. Angewandte Chemie - International Edition, 2022, 61(23): e202202330.
DOI:10.1002/anie.202202330
7.
Zhu, C., Gu, X.-K., Li, W.-X. Bimetallic Cu/Rh Catalyst for Preferential Oxidation of CO in H2: a DFT Study. Journal of Physical Chemistry C, 2021, 125(36): 19697-19705.
DOI:10.1021/acs.jpcc.1c04645
8.
Wang, T.-R., Li, J.-C., Shu, W. et al. Machine-learning adsorption on binary alloy surfaces for catalyst screening. Chinese Journal of Chemical Physics, 2020, 33(6): 703-711.
DOI:10.1063/1674-0068/cjcp2004049
9.
Lin, H., Lin, H., Liu, J.-X. et al. Compensation between Surface Energy and hcp/fcc Phase Energy of Late Transition Metals from First-Principles Calculations. Journal of Physical Chemistry C, 2020, 124(20): 11005-11014.
DOI:10.1021/acs.jpcc.0c02142
10.
Su, H.-Y., Yu, C., Liu, J.-X. et al. CO activation and methanation mechanism on hexagonal close-packed Co catalysts: effect of functionals, carbon deposition and surface structure. Catalysis Science and Technology, 2020, 10(10): 3387-3398.
DOI:10.1039/d0cy00499e
11.
Chen, P.-P., Zhang, B.-Y., Gu, X.-K. et al. Ethylene adsorption on Ag(111), Rh(111) and Ir(111) by (meta)-GGA based density functional theory calculations. Chinese Journal of Chemical Physics, 2019, 32(4): 437-443.
DOI:10.1063/1674-0068/cjcp1902035
12.
Zhang, T., Wu, Y., Zhang, J. et al. Insight into activation of CO and initial C 2 oxygenate formation during synthesis of higher alcohols from syngas on the model catalyst K 2 O/Cu(111) surface. Applied Surface Science, 2019.
DOI:10.1016/j.apsusc.2019.02.046
Table
Ⅱ.
Calculated activation energies (Ea in eV), reaction energies (Er in eV) of the elementary reactions involved in methanol synthesis from CO and CO2 on Cu(221) and CuZn(221).


 DownLoad: